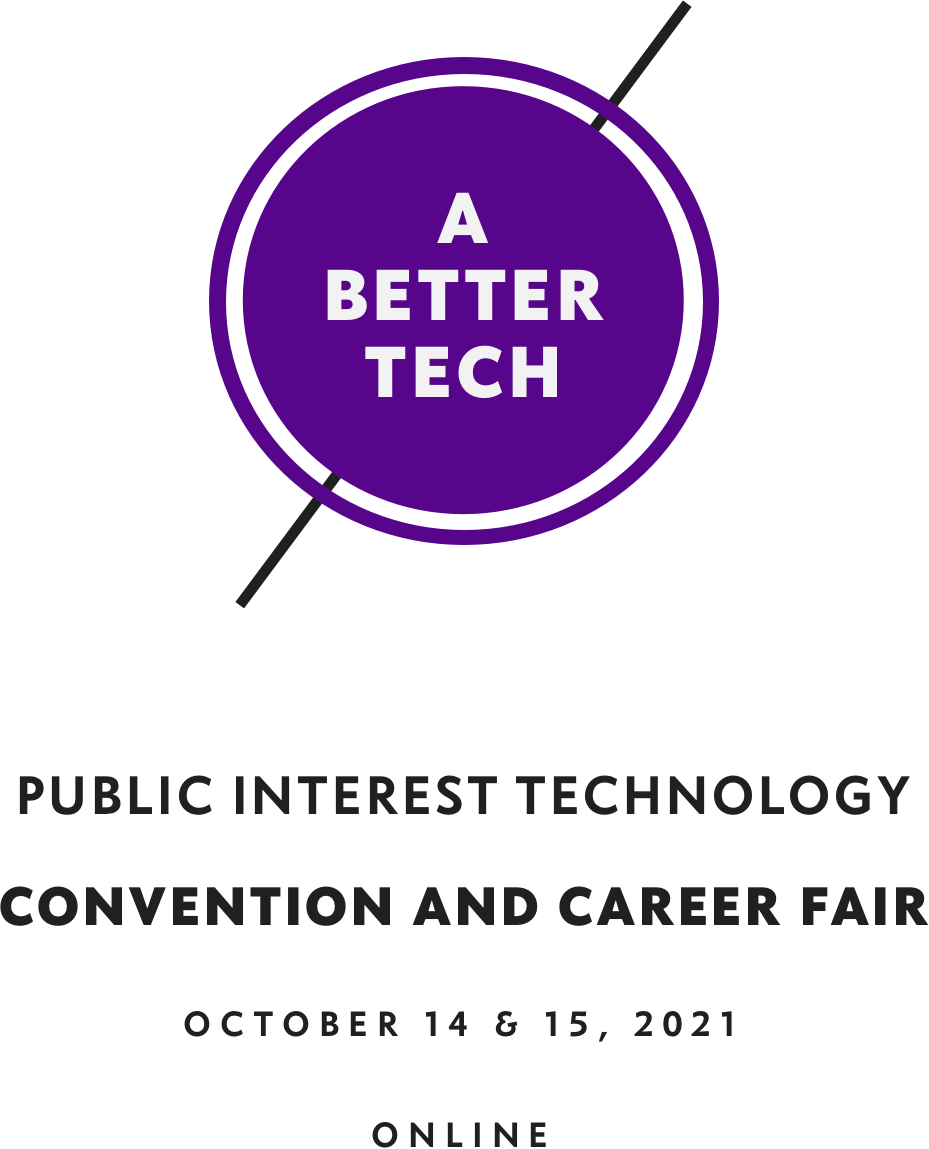
Event Production: A BETTER TECH
My role: I was the Producer for the 2021 NYU Public Interest Technology (PIT) Convention and Career Fair, a virtual hands-on event for professionals, researchers and students interested in creating a better world through technology. This meant I led marketing, digital, video production, and more.
About A BETTER TECH:
ABT was the first convening of its kind in the US, bringing together the country’s most talented students and leading researchers with organizations and companies that are at the forefront of creating responsible and accountable tech that serves the public interest.
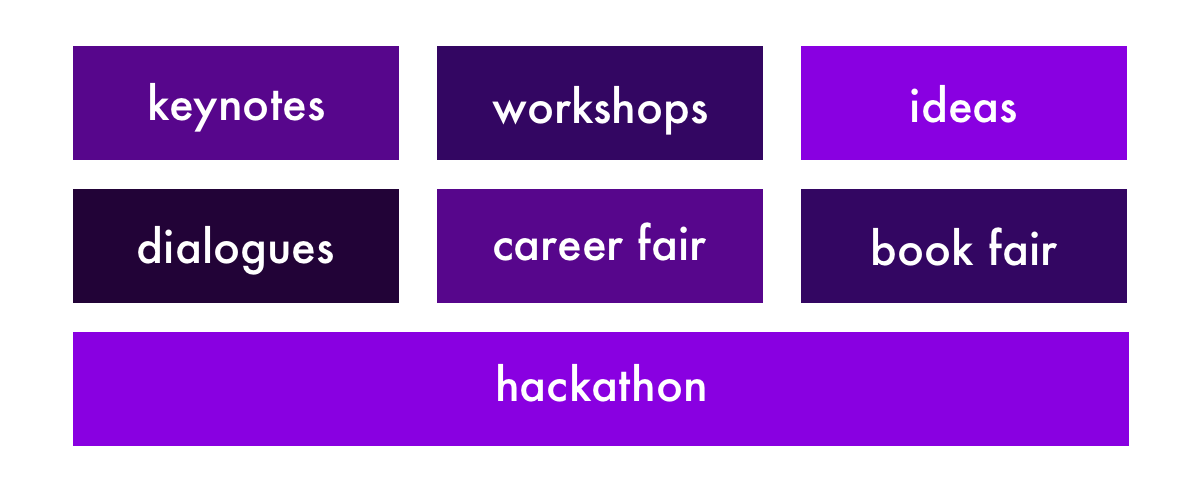
Through hands-on workshops, dialogues, keynotes, ideas presentations, a hackathon and a virtual career fair, participants shared the latest developments in the PIT field, learned about careers in PIT, and connected with professionals working in this area across lots of different sectors and industries.
I led multiple areas on this project including:
Marketing: Social media, the bi-weekly Newsletter, most graphic design
Website + Digital: design, coding, copy
Production: planning, video production, coordinating with internal NYU partners, leading day-of event coordination
Hackathon: working with our non-profit partner, Democracy Lab
Moderating and organizing the Decentralization panel
Pre-Production
Project Planning
I led planning and project management for the event in Asana and using a shared gantt chart in google sheets. The planning phase was crucial to successful completion of the project.
Event elements
Delivery phase
Marketing Strategy
It’s difficult to quantify the work that goes into an event like this, but what follows are just a few examples from our strategy for engagement. Because of the scope of this event—and the fact that it was a first-time event—we had to deploy multiple levels of engagement for: students, career centers, professionals and researchers in order to engage the wide audience we were targeting.
Post-Production
How-To Manual
When the event was over, I was lead writer for this guide intended to show others how to put on an event just like ours.
Logos and media
Web Logo
Small Logo
Sample newsletter ad

Sample Eventbrite design

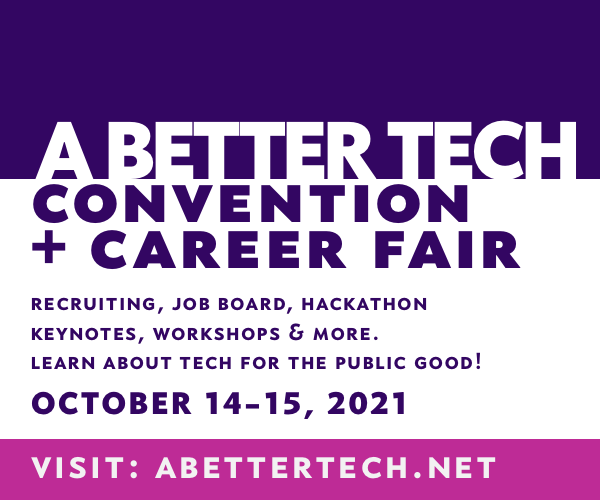
Sample social media card
Final Numbers
I compiled the following numbers for our final grant report. Our amazing team ended up directly engaging 3,439 people in A BETTER TECH, where the total number of people reached was approximately 12,000.
Event Day Numbers
12 Workshop Presenters
728 Workshop Registrants
6 Total Workshops
41 Dialogues Presenters
258 Dialogue Registrants (12 Total Dialogues)
16 Keynote Speakers (5 Total Keynotes)
9 Book Talk Speakers (2 Total Book Talks)
27 Ideas Presentations (4h20min Runtime for Ideas Session)
105 Total Presenters
1094 Total Eventbrite Registrants
567 Minutes of Material on YouTube from both days (approx 9 hours)
Marketing Stats
Website (AllTime: July 2021-Nov 2021)
13K Visits
9.2K Unique Visitors
21K Pageviews
Top sources by Visits: Direct (8,862 Visits), Google (1,064), Twitter (1,017), LinkedIn(611). Others (1,419).
Newsletter
1140 Newsletter Subscribers
61% Average Open rate
Approx Newsletter Audience Breakdown:
33% graduate students
25% undergraduates
12% recent graduates
11% early-career professionals
10% mid-career professionals
10% other (includes faculty, career services, researchers)